Florida Visitors
- Three years of data were collected from Visit Florida.
- Although, all year’s show a slightly different pattern, averaging the numbers out per quarter delivered the distinct and recognizable pattern as shown. Likewise, a five year average (or even geometric averages) would show slightly different patterns, but the seasonality is unmistakable.
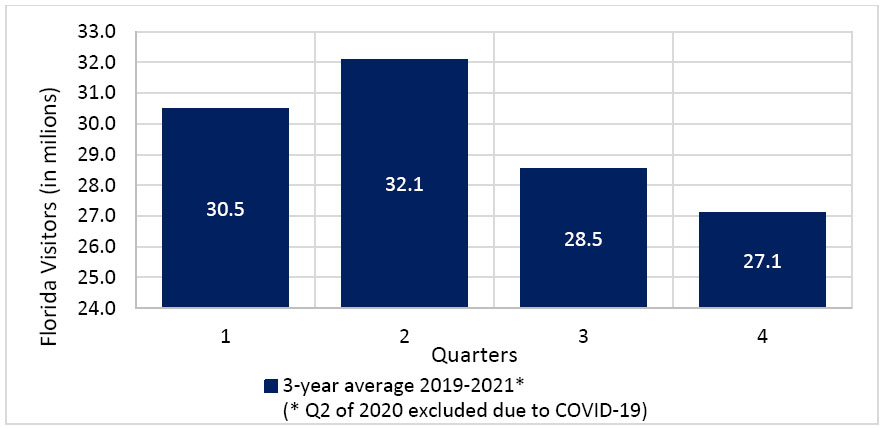
- In short, Florida has a distinct seasonal pattern in tourism, as depicted in Figure 1.
Figure 1. Florida’s Seasonal Tourism Pattern, three year averages per quarter, years 2019 through 2021 (excl. 2020: Q2 due to COVID-19).
Figure 1. Florida’s Seasonal Tourism Pattern, three year averages per quarter, years 2019 through 2021
(excl. 2020: Q2 due to COVID-19).

Starting the season off with the third quarter at 28.5 million visitors, a drop is experienced in the fourth quarter to 27.1 million on average, or a drop of approximately 5 percent. Turing into the winter season (first quarter) an increase is seen to 30.5 million or an increase of 12.4 percent on average, this over the fourth quarter, which includes October (or 6.8 percent with respect to the third quarter). Spring, or Spring-Break (second quarter) is the visitor high season for Florida, with on average 31.2 million visitors. This represents an increase of 12.5 percent over the seasons’ start in the third quarter.
- The Covid-19 recession did impact the number of visitors to Florida hence the second quarter was excluded in the average (as an extreme outlier). Similarly, the 2020 numbers for the third and fourth quarter were a tad lower than usual but show the same pattern with the fourth quarter with lower numbers than in the third quarter.
- Indexed on the third quarter being 100, the fourth quarter score 95.o, the first quarter 106.8 and the second quarter 112.5.
